Carpool for the Planet


Need a ride?
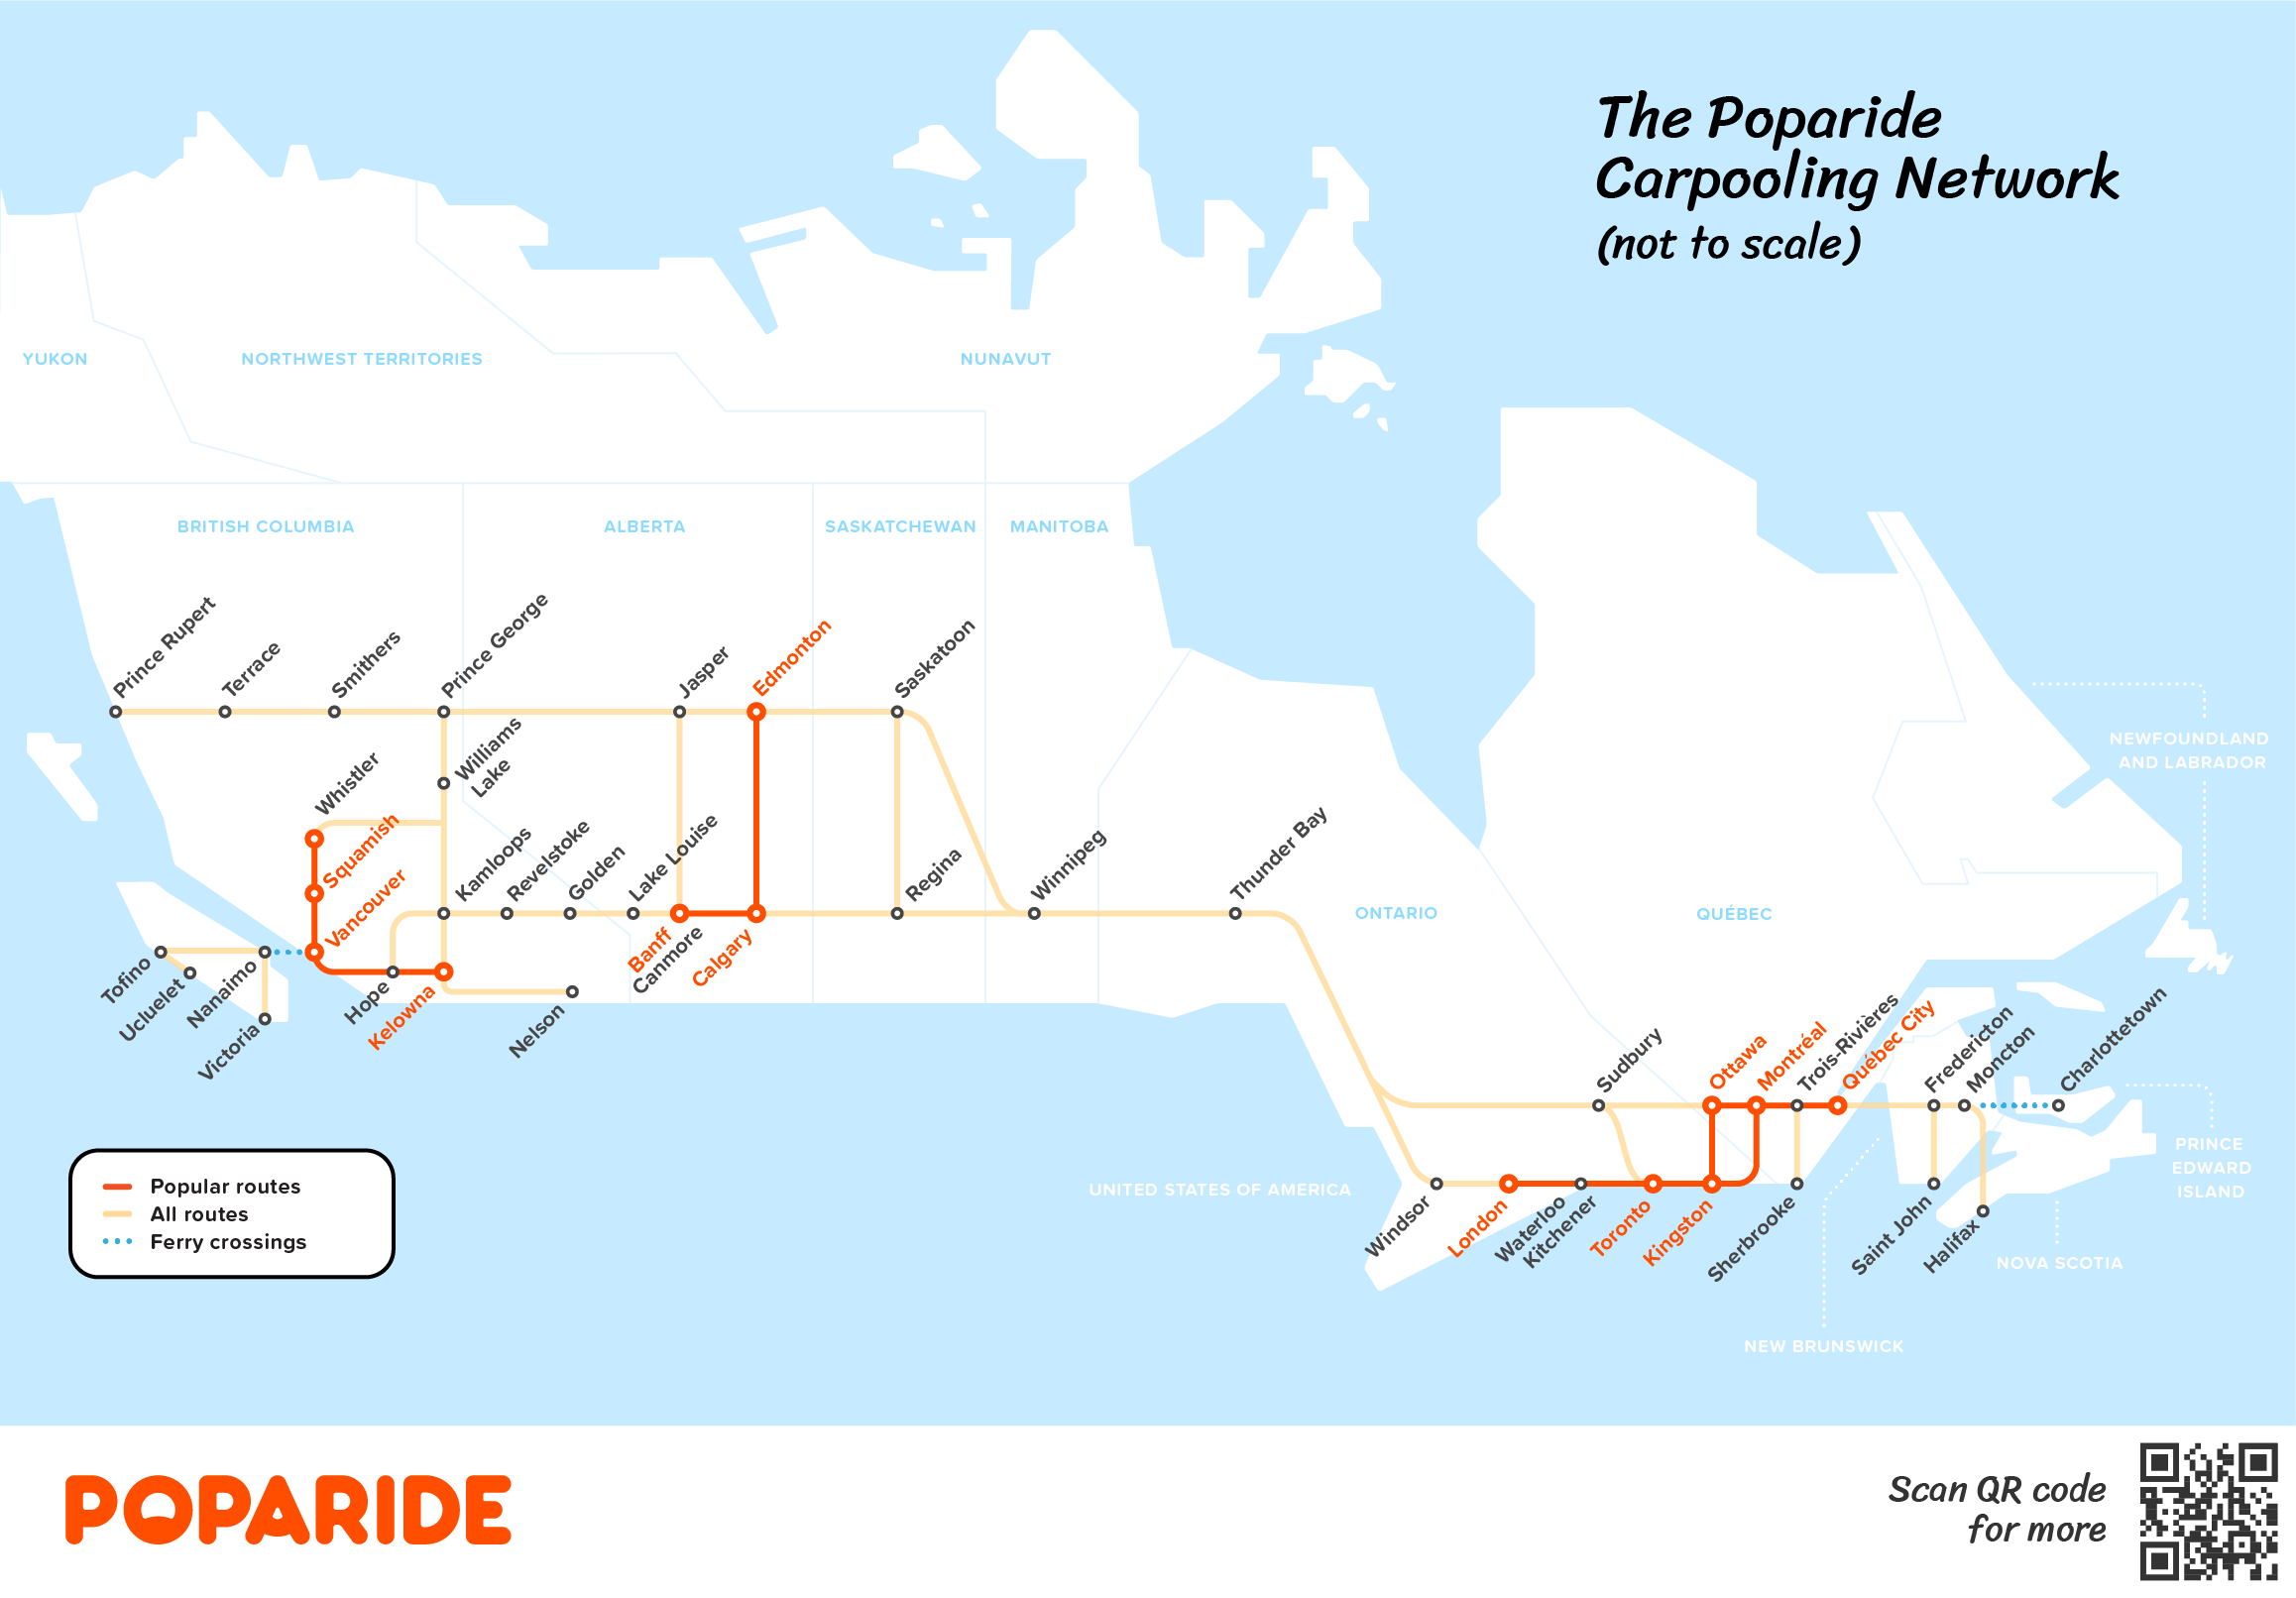
Find a ride and carpool anywhere in Canada.
Driving somewhere?
City A
City B
Post empty seats and collect money to cover your driving costs.
Post your trip
Over 26,000 metric tons
of CO2 saved since 2015
of CO2 saved since 2015
Learn how we're reducing our carbon footprint.
Read more
We receive a 4.7 star rating on average
"Great app and great drivers!"
"Good app, simple to use. Makes sense when you are heading the same way!"
"Great app. I felt safe on my first two ride-shares this week. "
"Safest and most reliable Canadian rideshare platform."
"Best ride ever!"
"We had an excellent experience for our first time using Poparide. Would book again!"
"This service is awesome. I recommend it to everyone."
"Awesome service! You find verified rides across province! Fast & reliable."
"Invaluable service. Most importantly, having company breaks the monotony of a long drive."
"A great tool to cover gas expenses!"
"Professional team and professional platform. Well done."
Carpool
in British Columbia
Vancouver to Whistler
$15 per seat
Vancouver to Squamish
$10 per seat
Squamish to Whistler
$10 per seat
Kelowna to Vancouver
$50 per seat
Kelowna to Kamloops
$20 per seat
Vancouver to Victoria
$15 per seat
Carpool
in Alberta
Calgary to Banff
$20 per seat
Banff to Lake Louise
$10 per seat
Canmore to Calgary
$15 per seat
Calgary to Edmonton
$40 per seat
Calgary to Saskatoon
$80 per seat
Calgary to Vancouver
$100 per seat
Carpool
in Ontario
Toronto to Ottawa
$50 per seat
Toronto to Montreal
$55 per seat
London to Toronto
$30 per seat
Hamilton to Toronto
$10 per seat
Kingston to Toronto
$35 per seat
Kingston to Ottawa
$25 per seat
Carpool
in Quebec
Quebec City to Montreal
$25 per seat
Montreal to Ottawa
$25 per seat
Montreal to Toronto
$55 per seat
Montreal to Sherbrooke
$15 per seat
Quebec City to Ottawa
$35 per seat
Montreal to Trois-Rivières
$15 per seat


